This article was recently published on Kyith Ng's blog and is republished with permission.
|
Administrative expenses were 3.2 mil higher, or 119% higher, due mainly to one-off expenses related to the acquisition, such as stamp duty paid for the investment property acquired and legal and professional fees amounting to 1.98 mil. I thought that the currency movement between Renminbi and Singapore dollars would allow for some currency gains, but that ended up with a slight loss, much to my disappointment. |
Maiden results from the flyer
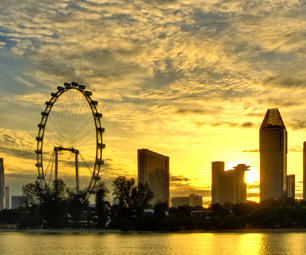
 The Singapore Flyer. Photo: CompanyIn terms of segmental reporting, there is a clear segregation between the Aquariums, which refers to SOA (Shanghai Ocean Aquarium) and UWX (Underwater World Xiamen), and Giant Observation Wheel (GOW), which refers to the Singapore Flyer. The Lintong cable car goes under "other operations".
The Flyer, which cost $140 mil to purchase is accounted as $92 mil of plant, property and equipment, and $50 mil as investment property. Instead of paying with cash, management decided to borrow $94 million to finance it.
The reason for not paying off with cash is, I believe, the more lucrative carry trade since interest income in Renminbi is much higher than that of the borrowing cost in SGD. Considering its $112 mil cash, Straco is still in a net cash position.
|
||||||||||
The segmental data reflects 1 month of operation (see table on the right).
We do not know where the $1.98 mil one-off acquisition expense is recorded, but highly believe that it would be under administrative expenses. If this expenses is one off, and if you account for it, then the PBT for the GOW segment would actually end up positive.
The expenses here works out to be: 3.7 – 0.13 – 0.7 + 0.6 = 3.47 mil.
A check of previous 3 quarters of overall operating expenses (which do not include any GOW numbers since it wasn’t recorded) was consistently $1 mil higher than 2013. Since this quarter, operating expenses were higher by 3.4 mil, it leads me to believe that the operating expenses attributable to GOW could be 2.4 mil.
If you subtract 2.4 mil and 1.98 mil (one off acquisition expenses) from 3.47 mil, you get 0.9 mil, which is pretty close to the 0.7 mil in depreciation.
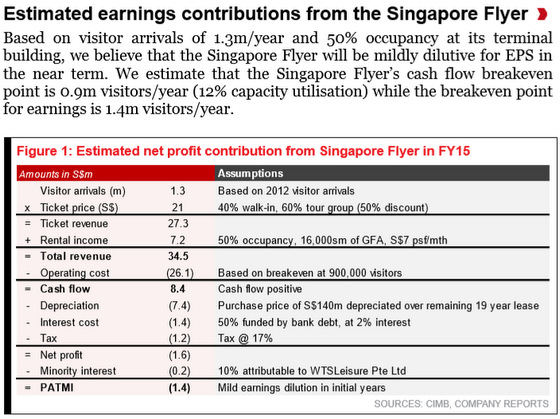
The surprising thing to me about this result was that if we don’t consider the one-off expenses, the Flyer was profitable. When I first computed the possible value based on the estimates CIMB released back in Aug 2014 (read here), we only thought it would be cash flow positive.
This number seems a far-cry from the analyst estimates, which is a lesson to us all that we should a lot of time take analysts' figures provided with a pinch of salt.
It would be easy for us to estimate the PBT for full year to be –0.6 +1.98 = 1.38 mil x 12 months = 16.56 mil – 1.65 mil (minority share holders) – 2.8 mil (tax) = 12.11 mil.
In terms of cash flow we can add back 8.4 mil in depreciation and that will come up to 20.5 mil.
The problem is that this kind of estimation will never work since after we are familiar with Straco's aquarium that tourist arrivals are not uniform and this kind of extrapolation is bound to end in tears.
Secondly, capital expenditure to improve the place has not been considered, and perhaps would reduce cash flow in the short term.
Thirdly, we have seen many changes in the past one month. A few tenants seem to have moved out and perhaps some tenants came in. Since we are aware that the past rents were below market rates, and occupancy was not at full capacity, there is room for improvement but also short term impact as tenants move out and new tenants need time to renovate the place.


FY2014
Segment PBIT
Aquariums - 62,694
GOW - (598)
Others - 1,198
total - 63,294
PBIT as P&L - 57,641
Diff - 5,653
FY2013
Segment PBIT
Aquariums - 49,010
Others - 2,668
total - 51,678
PBIT as P&L - 50,270
Diff - 1,408
Go figure where are those one off items being recorded in segment P&L.
Straco pretty much shout out where they dump those number.
Straco group structure say it might more than just a simple carry trade.