Excerpts from analysts' report
|
|
Some bottom-line concerns
We took a closer look at the bottom-line and observed that FY11-13 after-tax net profits are largely buttressed by tax credits. Management guides for an increase in administrative expenses due to higher headcount from expanded operations and M&A expenses, and also expects to incur some costs during the transition and consolidation of business operations. Overall, consensus forecasts that DeClout’s net profit will rise from S$1.9m in FY13 to S$3.7m in FY14 and S$6.4m in FY15.
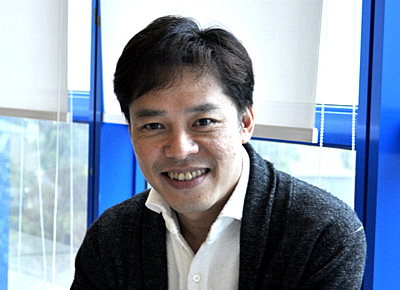
We note that the company suffered a net loss of S$2.1m in 1H14. Given that consensus expects a net profit of S$3.7m in FY14, this would imply a significant turnaround in 2H14 of S$5.8m.  Vesmond Wong, chairman and CEO of DeClout.
NextInsight file photo.VALUATION
Higher earnings growth but more expensive than peers
Based on consensus estimates, DeClout trades at 13.5x CY15 P/E and 8.2x CY16 P/E, which are below the industry average of 16.4x in CY15 and 14.1x in CY16. However, DeClout has the highest 3-year EPS CAGR of 56.5% in the industry, significantly higher than the 5.1% peer average.
However, we note that the company has significantly smaller market capitalisation than its US-listed peers, which are more established and have greater presence in international markets.
We also note that Shanghai DragonNet Technology (listed in Shenzhen), the closest peer to DeClout’s Procurri business is trading at CY15 P/E of 46.8x versus 13.5x for the entire DeClout Group currently. By spinning off Procurri in Hong Kong, DeClout may be able to unlock the potential of Procurri and create value for shareholders.
Recent story: DECLOUT: Shareholder buys 23 million shares in 3 weeks


